Automate Excel Reports: Start From a Template, Not an Empty Workbook
Generate formatted Excel reports programmatically instead of manually
Python-generated reports look generated because they were built from nothing. Open a workbook someone designed and fill it instead — and learn the one flag that silently turns every formula in a file into a static number.

The reason most Python-generated Excel reports look like Python-generated Excel reports is that they were built from an empty workbook. Every column width, every number format, every heading style had to be written in code, so most of them were not.
There is a much better pattern, and one specific trap that silently destroys formulas. Both are below, along with the division of labour between pandas and openpyxl that makes this straightforward rather than tedious.
pandas computes, openpyxl presents
These are not competing libraries and choosing between them is the wrong question.
pandas is for the data: reading, joining, grouping, aggregating. It is bad at formatting, because formatting is not what a dataframe is. openpyxl is for the workbook: styles, number formats, column widths, charts, print settings — and it is slow and awkward for arithmetic.
Use pandas to produce the numbers and openpyxl to place them somewhere that looks deliberate.
import pandas as pd
from openpyxl import load_workbook
from openpyxl.utils.dataframe import dataframe_to_rows

summary = (pd.read_csv("sales.csv")
             .groupby("region", as_index=False)["amount"].sum()
             .sort_values("amount", ascending=False))

wb = load_workbook("template.xlsx")        # a workbook someone designed
ws = wb["Summary"]

for r, row in enumerate(dataframe_to_rows(summary, index=False, header=False), start=4):
    for c, value in enumerate(row, start=2):
        ws.cell(row=r, column=c, value=value)

wb.save(f"sales-{pd.Timestamp.today():%Y-%m}.xlsx")
Start from a template, always
This is the single change that improves output most, and it takes the work out rather than adding it.
Build the report once in Excel — headers, fonts, colours, a chart, the print area, the frozen header row, the company logo. Save it as template.xlsx and commit it. Your script opens it, writes values into known cells, and saves under a new name.
Everything you did not write code for is preserved, because you never recreated it. Charts keep their formatting. Conditional formatting rules survive. Print setup survives, which matters more than it sounds when someone prints your report and gets forty pages of one column.
It also puts the design where a non-programmer can change it. When someone asks for the header to be a different blue, they can do it themselves in Excel and commit the template.
The trap: data_only=True
This catches everyone exactly once, and it is worth understanding rather than memorising.
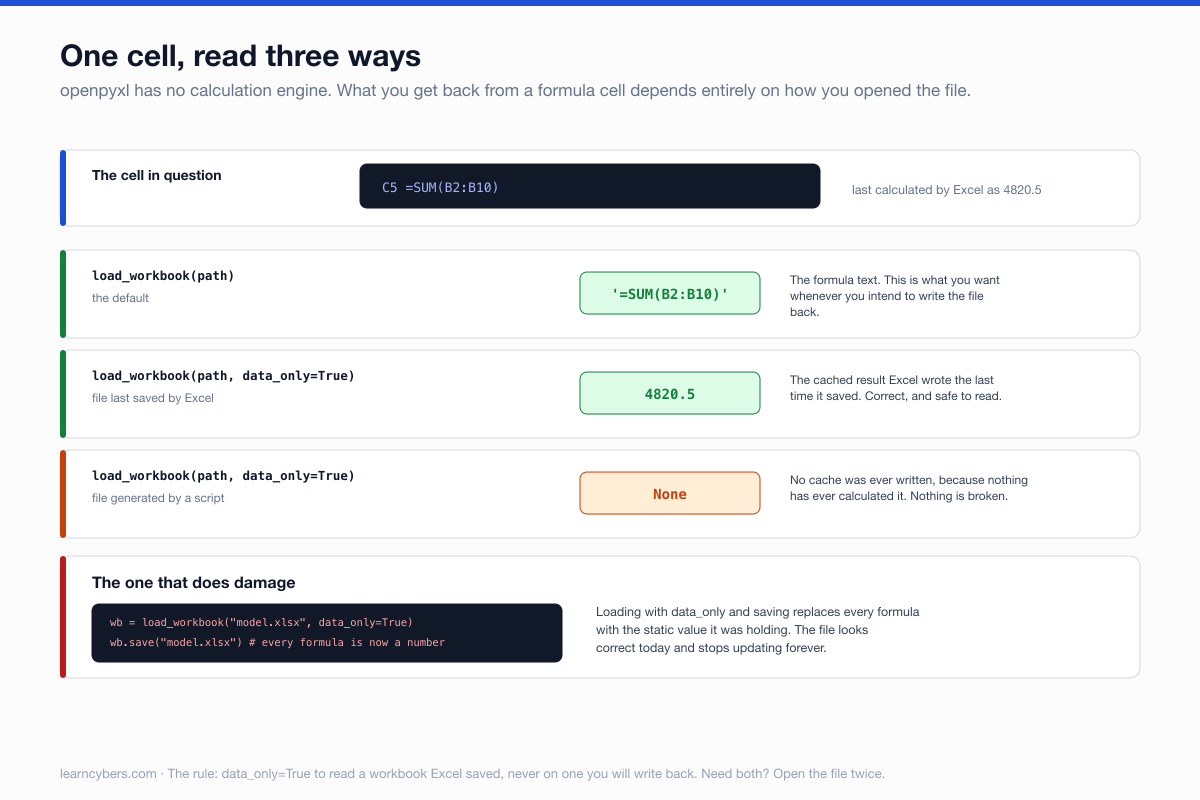
openpyxl does not evaluate formulas. It is not Excel; there is no calculation engine. So a cell containing =SUM(B2:B10) can be read two ways:
wb = load_workbook("report.xlsx")                   # default
wb["Sheet1"]["C5"].value        # '=SUM(B2:B10)'    -- the formula text

wb = load_workbook("report.xlsx", data_only=True)
wb["Sheet1"]["C5"].value        # 4820.5            -- the cached result
The cached result is whatever Excel calculated the last time it saved the file. Which produces the two failures people hit:
You get None. If the file was generated by a script and never opened in Excel, no cache was ever written. The formula is there, the value is not, and data_only=True returns None for every formula cell. Nothing is broken — the number has simply never been computed by anything.
You destroy every formula. This is the damaging one. Load with data_only=True, change one unrelated cell, save — and every formula in the workbook has been replaced by the cached number it held. The file still looks right today and stops updating forever.
# Never do this to a workbook you intend to keep
wb = load_workbook("model.xlsx", data_only=True)
wb["Sheet1"]["A1"] = "updated"
wb.save("model.xlsx")          # all formulas are now static values
The rule: use data_only=True when you are reading a workbook Excel has saved, and never on a workbook you are going to write back. If you need both the formulas and the values, open the file twice.
The formatting that makes it look professional
Four things account for most of the difference, and all of them are one line each.
from openpyxl.styles import Font, Alignment
from openpyxl.utils import get_column_letter

# 1. Number formats — the biggest single improvement
for row in ws.iter_rows(min_row=4, min_col=3, max_col=3):
    for cell in row:
        cell.number_format = '#,##0.00'        # 4,820.50
ws["D4"].number_format = '0.0%'                # 12.5%
ws["E4"].number_format = 'dd mmm yyyy'         # 21 Sep 2026

# 2. Column widths — openpyxl will not size them for you
for i, width in enumerate([28, 14, 14, 12], start=1):
    ws.column_dimensions[get_column_letter(i)].width = width

# 3. Freeze the header so it survives scrolling
ws.freeze_panes = "A4"

# 4. Filters on the header row
ws.auto_filter.ref = f"A3:D{ws.max_row}"
Number formats are worth dwelling on because they are cosmetic in the best way: the underlying value stays a float, so it still sums and charts correctly, while displaying as currency, a percentage or a date. Writing a pre-formatted string instead — "£4,820.50" — gives you text that looks right and will not add up.
Large files, and the modes that make them possible
The default loader builds the whole workbook in memory. On a file with hundreds of thousands of rows that is slow and can exhaust the machine.
# Reading: streams rows, keeps almost nothing
wb = load_workbook("huge.xlsx", read_only=True, data_only=True)
for row in wb["Data"].iter_rows(values_only=True):
    process(row)
wb.close()                      # read_only holds the file open until you close it

# Writing: append-only, cannot revisit a cell once written
from openpyxl import Workbook
wb = Workbook(write_only=True)
ws = wb.create_sheet()
for record in records:
    ws.append(record)
wb.save("huge-out.xlsx")
The constraints are real. In read-only mode max_row may be unreliable and cells are read once. In write-only mode you append rows in order and cannot go back to style a cell you have already written — so set up any styling as you append rather than in a second pass.
What not to do
Do not use win32com or Excel automation on a server. It requires Excel installed, it is not supported for unattended use, and it fails in ways that leave orphaned processes holding file locks. openpyxl is pure Python and needs nothing installed.
Do not build the layout in code. If you find yourself writing twenty lines of style objects, you are recreating a template that should be a file.
Do not write numbers as strings. The moment a value is text it stops summing, sorting and charting, and the person who receives the report will not be able to tell you why.
Do not assume .xls works. openpyxl handles the modern .xlsx format only. The old binary .xls needs a different library, and files that are secretly CSV with an .xlsx extension — which finance systems produce more often than you would believe — need detecting rather than parsing.
A scheduled report, end to end
Put the three pieces together and the whole job is short: read the source with pandas, open the template with openpyxl, write the values into known cells, apply number formats, save with a dated filename.
Run it from cron or a CI schedule rather than from someone's laptop, write the output somewhere the recipients already look, and log what it produced. The first month takes an afternoon. Every month after that takes nothing, which is the entire point.
Scope
Examples target current openpyxl and pandas. API details around read_only behaviour and max_row have shifted between versions, so verify against the release you install.
openpyxl reads and writes the Office Open XML format; it does not evaluate formulas, render charts, or execute macros, and a macro-enabled .xlsm will keep its macros only if you load it with keep_vba=True.