Power Query for people who clean the same spreadsheet every month
Stop doing manual data cleanup — Power Query does it in clicks
Record your cleanup once and replay it with a click. The transformations that matter, combining a whole folder of files, query folding and why refreshes get slow, and the automatic step you should always delete.

Power Query is the part of Excel that turns a weekly hour of copy-paste cleanup into a button. You import data, record the transformation steps once, and every future refresh replays them. It is built into Excel 2016 and later under the Data tab, and most people who own it have never opened it.
The mental model matters more than the button locations: Power Query does not edit your data. It records an ordered recipe of steps that is reapplied from the source every time you refresh. Nothing is destructive, every step is editable, and you can delete step four without losing steps five through twelve.
Loading something
Data → Get Data → From File → From Text/CSV, pick a file, then choose Transform Data rather than Load. That opens the Power Query Editor, which is where everything happens.
Three panes: the data preview in the middle, the column list, and Applied Steps on the right. Applied Steps is the important one — it is your recipe, and every action adds a line to it.
Delete the automatic "Changed Type" step
This is the first thing to learn, because it is what breaks most people's first query a fortnight later.
On import, Power Query adds a Changed Type step that hard-codes every column by name. When next month's export renames "Order Date" to "OrderDate", the step references a column that no longer exists and the whole query fails with a cryptic error.
Delete that step (the X beside it), do your cleanup, then set types deliberately as the last step. The query then survives upstream column changes that do not affect the columns you actually use.
The transformations worth knowing
Removing what you do not need
Right-click a column header → Remove, or select the ones to keep and use Remove Other Columns. Prefer the second: it states what you want rather than what you don't, so a new column appearing upstream does not silently land in your output.
Remove Rows → Remove Top Rows strips the title rows that reporting tools put above the real header. Then Use First Row as Headers.
Splitting and merging
Split Column → By Delimiter turns "Smith, John" into two columns. The advanced options handle the cases that catch people out: split at the left-most delimiter only, or the right-most — which is how you separate a filename from an extension when the name itself contains dots.
Unpivot
The single most valuable transformation, and the least intuitive. Data arrives wide — one column per month — and every analysis tool wants it tall, with month as a value.
Region  Jan  Feb  Mar        Region  Month  Sales
North   100  120  115   →     North   Jan    100
South    90  105  110         North   Feb    120
                              North   Mar    115
Select the columns to keep, right-click, Unpivot Other Columns. Use that rather than "Unpivot Columns": it means "everything except these", so when April arrives it is included automatically. Picking the month columns explicitly means editing the query every month, which defeats the purpose.
Group By
Transform → Group By produces summary tables — group on region, aggregate sum of sales — replacing nested SUMIFS with something readable. Advanced allows several groupings and several aggregations at once.
Merge and append
Two different operations that sound alike. Merge joins on a key, like VLOOKUP but with proper join types including left anti-join, which gives you the rows that did not match — the fastest way to find records missing from a lookup table. Append stacks tables with the same shape.
Combining a folder of files
The feature that justifies learning the tool. If you receive a file per month, per branch, or per supplier:
Data → Get Data → From File → From Folder, select the folder, then Combine & Transform.
Power Query builds a sample query from the first file, applies it to all of them, and stacks the result. Drop next month's file into the folder, hit refresh, and it is included. No formula edits.
Two practical notes. Add a column from the source file name if the date is only in the filename — it is preserved through the combine and is often the only thing identifying which period a row belongs to. And expect a failure the first time a supplier sends a file with a differently-named column; that is the problem to solve, not a reason to abandon the approach.
Parameters instead of hard-coded paths
A query with C:\Users\yourname\Desktop\data baked into it breaks on a colleague's machine. Home → Manage Parameters → New Parameter, create a text parameter for the folder, then edit the source step to use it. Changing the path is then one field rather than an expedition into the M code.
Query folding, and why refreshes get slow
The concept that separates people who find Power Query fast from people who find it unusable.
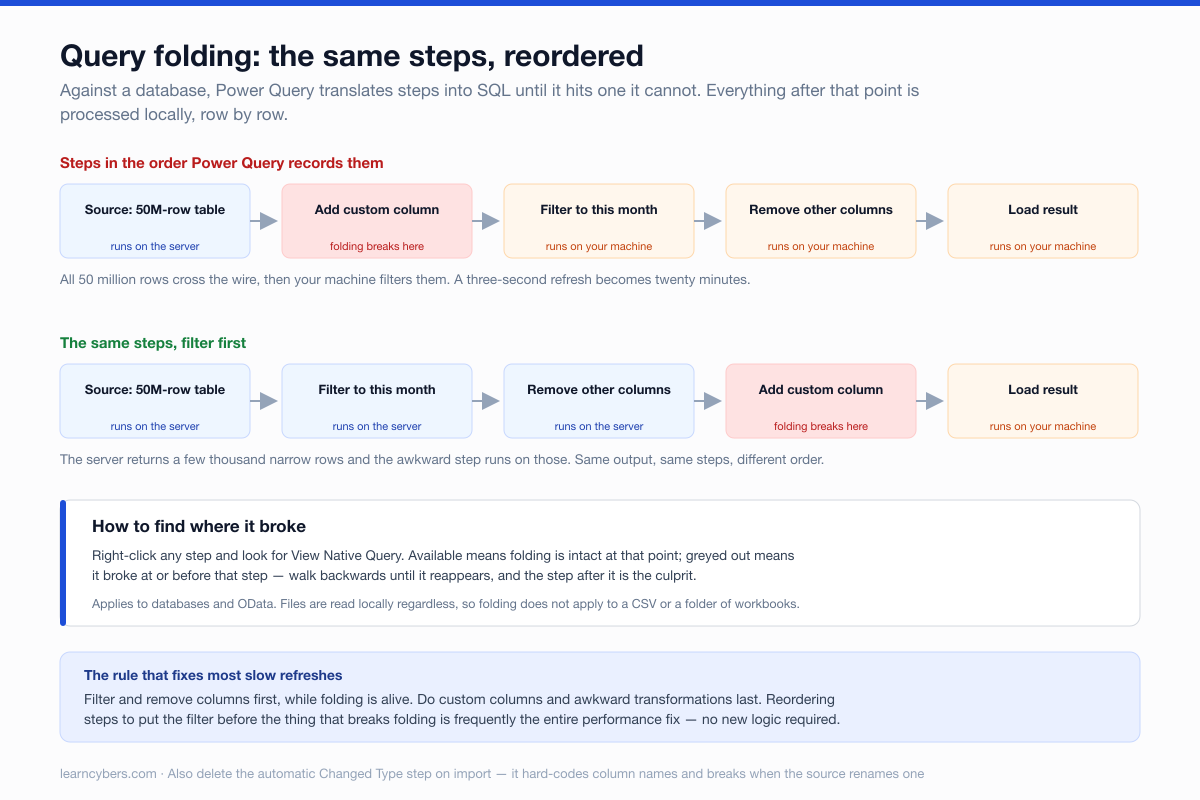
Against a database, Power Query tries to translate your steps into SQL and make the server do the work. That is query folding. When it folds, filtering a 50-million-row table is instant, because the rows never leave the database.
Some operations cannot be translated and break folding. Everything after that point is processed locally, row by row, on your machine. One badly placed step turns a three-second refresh into twenty minutes.
Right-click any step and look for View Native Query. If it is available, folding is still intact at that point; if it is greyed out, folding broke at or before that step.
The practical rule: filter and remove columns first, while folding is alive, and do custom columns and awkward transformations last. Reordering steps to put the filter before the thing that breaks folding is frequently the entire performance fix.
This applies to databases and OData sources. Files are read locally regardless, so folding does not apply.
Loading the result
Close & Load To — not plain Close & Load — lets you choose:
- Table — data lands in a worksheet. Fine under a million rows.
- Only Create Connection — nothing in the sheet; the query feeds other queries or a pivot table.
- PivotTable Report — straight into a pivot.
- Add to Data Model — into Power Pivot. Necessary above a million rows, since a worksheet cannot hold more.
For a staging query that only exists to feed another, choose Only Create Connection. Loading intermediate results to sheets is the usual cause of a workbook that takes minutes to open.
Refreshing
Data → Refresh All, or right-click a result table → Refresh. For automatic refresh, right-click the query → Properties → refresh every N minutes, or refresh on file open.
Refresh on open is usually what you want for a report someone else reads, so they cannot be looking at last month's numbers without realising.
A first project
Take the cleanup you currently do by hand:
- Import the raw file and choose Transform Data.
- Delete the automatic
Changed Typestep. - Remove the junk rows above the headers; promote the real header row.
- Remove Other Columns to keep only what you use.
- Filter out blanks and errors.
- Split or merge the columns that need it; unpivot anything cross-tabulated.
- Set data types — last.
- Close & Load To a table.
The first pass takes about as long as doing it manually. Every subsequent month takes one click, and that is where the whole return sits.
Menu locations differ slightly between Excel versions and between Windows and Mac; the Mac Power Query editor lags the Windows one in features. Check your version if something described here is not where you expect it.