Linux Kernel Module Debugging: printk, Dynamic Debug and ftrace
Practical debugging techniques for kernel-space code when things go wrong
printk is the tool most likely to hide the bug you are chasing. Dynamic debug switches instrumentation on per line at runtime with no rebuild, ftrace shows what actually ran, and faddr2line turns an oops into a source line.
The first thing most people do when a kernel module misbehaves is add a printk, rebuild, reload and read dmesg. It works, and for a straightforward logic bug it is the right amount of effort. It is also the technique most likely to make a timing bug disappear, flood the ring buffer until the interesting line is dropped, and leave debug output in the code you ship.
There is a better default, and it is already compiled into your module. This walks through the tools in the order you should actually reach for them, what each one costs, and how to read the oops you get when none of them saved you.
What printk is doing to your timing
printk is not a cheap function. It formats, takes a lock, writes to the ring buffer and — depending on your console — may push the string out over a serial line at 115,200 baud. A single call inside a spinlock-held region can change the shape of a race enough that the race stops happening, which is the classic Heisenbug: the bug is real, your instrumentation is what removed it.
It also drops messages. When the ring buffer fills faster than the console drains it, the kernel tells you so and moves on:
[ 412.883104] ** 1274 printk messages dropped **If you are printing from a hot path — a packet handler, an interrupt, a character device write — assume you are seeing a sample rather than a log. Two things help. Use the rate-limited variant so one noisy path cannot starve everything else:
printk_ratelimited(KERN_INFO "mymod: queue depth %u\n", depth);
/* or, keeping the module prefix automatic: */
pr_info_ratelimited("queue depth %u\n", depth);
And define pr_fmt once at the top of the file so every message is greppable without you remembering to prefix it:
#define pr_fmt(fmt) KBUILD_MODNAME ": %s:%d: " fmt, __func__, __LINE__One practical note on reading the output: dmesg -w follows the buffer live, and dmesg -T gives you wall-clock timestamps instead of seconds since boot. The raw timestamps are more precise and better for measuring intervals; the human ones are better for correlating with anything outside the kernel.
Dynamic debug: the tool that should be your default
This is the part of kernel debugging that changes how the work feels, and it is routinely skipped in tutorials.
Every pr_debug() and dev_dbg() call in your module compiles into a no-op with a registration record attached, provided the kernel was built with CONFIG_DYNAMIC_DEBUG — which every mainstream distribution kernel is. The calls cost nothing while they are off. You then switch individual ones on at runtime, by file, by line, by function or by module, with no rebuild and no reload:
# everything in the module
echo 'module mymod +p' > /sys/kernel/debug/dynamic_debug/control

# one file
echo 'file mymod_rx.c +p' > /sys/kernel/debug/dynamic_debug/control

# one function, with the calling thread's pid attached to each line
echo 'func mymod_handle_irq +pt' > /sys/kernel/debug/dynamic_debug/control

# one line, because you already know roughly where it is
echo 'file mymod_rx.c line 214 +p' > /sys/kernel/debug/dynamic_debug/control

# and off again
echo 'module mymod -p' > /sys/kernel/debug/dynamic_debug/control
The flags after the + decide what gets attached to each line: p enables the print, f adds the function name, l the line number, m the module and t the thread ID. Read the current state — including which of your statements are enabled — straight out of the same file:
grep mymod /sys/kernel/debug/dynamic_debug/controlYou can also switch statements on before the module has initialised, which is where a lot of driver bugs live. Pass the query as a module parameter at load time:
insmod mymod.ko dyndbg="+p"
# or for a built-in, on the kernel command line:  mymod.dyndbg=+pflmt
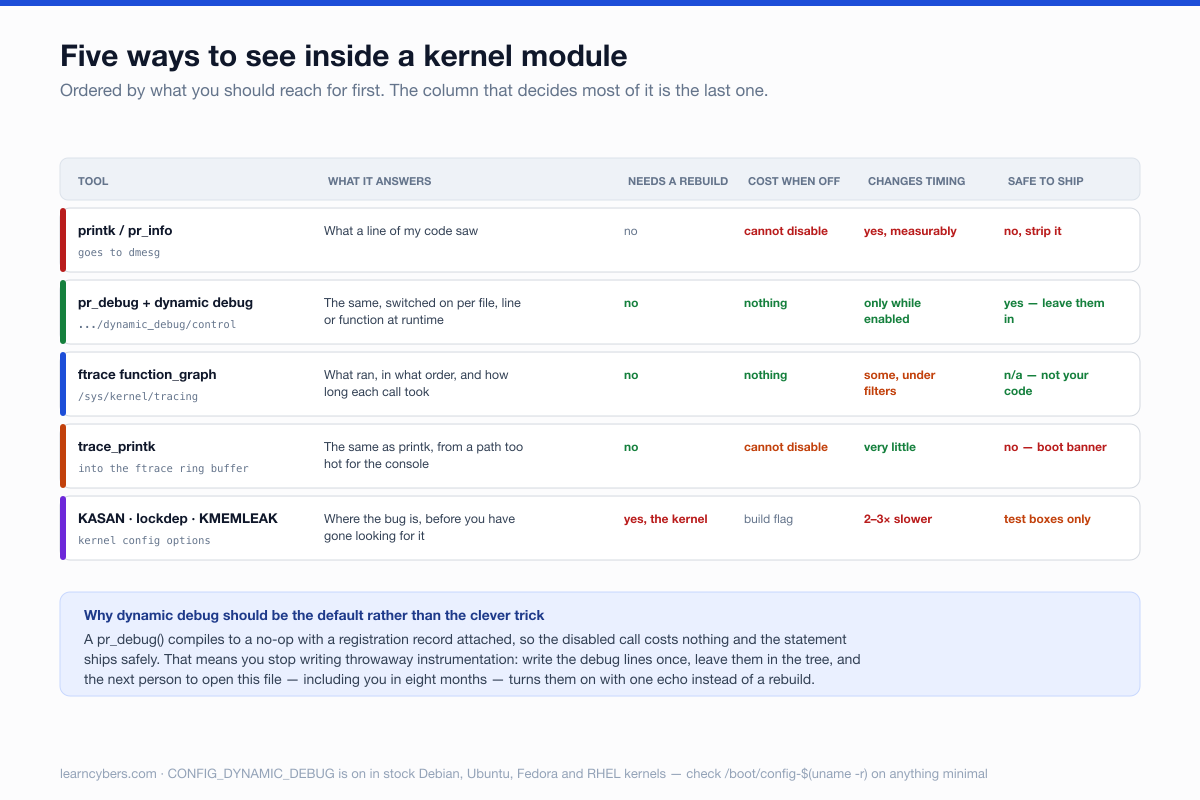
The habit worth forming: write pr_debug() everywhere you would have written a temporary printk, and leave them in. They cost nothing disabled, they ship safely, and the next person to debug this code — including you in eight months — gets your instrumentation for free instead of writing it again.
ftrace, when you need to know what ran
Dynamic debug tells you what a line of your code saw. ftrace tells you what the kernel actually called, in order, with timings — which is the question you have when a function is not being reached at all, or is being reached from somewhere you did not expect.
The tracing filesystem lives at /sys/kernel/tracing on current kernels (/sys/kernel/debug/tracing on older ones, and the two are the same thing).
cd /sys/kernel/tracing
echo 0 > tracing_on
echo function_graph > current_tracer

# trace only your module's symbols, or the whole machine drowns you
echo 'mymod_*' > set_ftrace_filter

echo 1 > tracing_on
cat trace_pipe          # blocking read, drains as it goes
echo 0 > tracing_on
The function_graph tracer is the one to start with, because it gives you call nesting and a duration for every call:
2)               |  mymod_write() {
 2)   0.412 us    |    mymod_validate();
 2)               |    mymod_enqueue() {
 2)   8.917 us    |      __kmalloc();
 2) + 31.244 us   |    }
 2) + 34.108 us   |  }
A + beside a duration means over ten microseconds and a ! means over a hundred — which turns "the write path feels slow" into a line number without any measurement code.
Two filters are worth knowing beyond the basics. set_ftrace_notrace excludes symbols you do not care about, and set_graph_function restricts the trace to calls made below a chosen entry point, which is usually what you actually want when a module is called from several places.
There is also trace_printk(), which writes into the ftrace ring buffer rather than the console. It is genuinely fast — roughly the cost of a memcpy — so it is the right tool for instrumenting a hot path where printk would change the timing. It is also not for shipping, and the kernel makes that unmissable: the first use prints a large boxed warning at boot telling you a debugging function is compiled in. Treat that banner as a build-blocking lint rule.
Reading the oops properly
When it panics, the interesting lines are not the register dump.
BUG: kernel NULL pointer dereference, address: 0000000000000008
RIP: 0010:mymod_release+0x1f/0x40 [mymod]
Tainted: G           OE      6.8.0-generic #1
Call Trace:
 __fput+0xa5/0x290
 task_work_run+0x59/0x90
Three things to take from it.
The RIP line gives you the function, the offset into it, and its total length — +0x1f/0x40 is byte 31 of a 64-byte function. That is enough to get an exact source line, and the kernel tree ships the tool:
./scripts/faddr2line mymod.ko mymod_release+0x1f/0x40Build with CONFIG_DEBUG_INFO and keep the unstripped .ko, or this gives you nothing. Keeping a copy of the exact module you loaded, per build, is the difference between a five-minute diagnosis and a guess.
The taint flags tell you what the kernel thinks of its own state. O means an out-of-tree module is loaded, which for your own module is expected and harmless. E means an unsigned module was loaded. P means something proprietary is in there, and D means the kernel has already oopsed once before this one — which matters, because the first oops is the one to debug and the later ones are often consequences.
The call trace read bottom-up tells you who called you. In the example above the crash is in release, reached through __fput from task_work_run — that is a file being closed, so the question is what release does with state that may already have been freed, not what the caller passed in.
Let the kernel find the bug instead
The tools above help you look. These make the kernel tell you, and on a development machine they are worth the rebuild.
- KASAN (
CONFIG_KASAN) catches use-after-free and out-of-bounds access at the moment it happens, and prints both the allocation and the free stack. Most module memory bugs that present as a mysterious crash somewhere else are caught immediately by KASAN, at the actual fault. It costs a lot of memory and roughly a 2–3× slowdown, which is fine for a test box. - lockdep (
CONFIG_PROVE_LOCKING) finds deadlocks you have not had yet. It builds a graph of lock ordering across the whole kernel and complains the first time you take two locks in an order that contradicts an order seen elsewhere — so a deadlock that would need a specific race to trigger gets reported from a single clean run. - KMEMLEAK (
CONFIG_DEBUG_KMEMLEAK) finds allocations nothing points at any more. Trigger a scan and read the report:echo scan > /sys/kernel/debug/kmemleak cat /sys/kernel/debug/kmemleakExpect false positives — it is a conservative scanner, not a tracing collector — but a leak that grows every time you load and unload your module will be unmistakable in the list.
If you are building a module that will be loaded and unloaded repeatedly, the single highest-value habit is a loop: insmod, exercise, rmmod, a hundred times, on a KASAN and lockdep kernel. Module unload paths are the least-exercised code in any driver and the most likely to be wrong.
Choosing, in one paragraph
Start with dynamic debug, because it costs nothing, needs no rebuild and covers the question "what did my code see". Move to ftrace when the question is "what ran, in what order, and how long did it take". Reach for trace_printk only when you need instrumentation inside a path too hot for the console, and delete it before you commit. Turn on KASAN and lockdep for anything you intend other people to load. And keep the unstripped module for every build you test, because the oops you cannot decode is the one that costs you the afternoon.
Versions and scope
Paths and configuration names here are current for the 6.x series. The tracing directory moved from /sys/kernel/debug/tracing to /sys/kernel/tracing and both are still present on most systems. CONFIG_DYNAMIC_DEBUG is enabled on Debian, Ubuntu, Fedora and RHEL stock kernels, but a minimal or embedded build may not have it — check /proc/config.gz or /boot/config-$(uname -r) before assuming. KASAN and lockdep require a kernel rebuild and are not available on a stock distribution kernel.
The output samples above are representative formats rather than captures from a specific failure, and no timing figures here are our own measurements.